
 Atta 🐬
In this post
- Open Activity Monitor
- Step 1: Check the CPU tab
- Step 2: Check memory pressure
- Step 3: Check the Energy tab
- Step 4: Check your storage
- How to quit an app safely
- The processes that look scary
- Other fixes worth trying
- Where Activity Monitor falls short
- Vitals: Activity Monitor, with the answers
- Frequently asked questions
Quick answer
A slow Mac usually has one cause you can find in Activity Monitor: an app using too much CPU, memory running out, heat, a nearly full disk, or Spotlight indexing after an update. Open Activity Monitor, sort the CPU tab by % CPU, and check the Memory Pressure graph in the Memory tab: yellow or red means your apps need more memory than the Mac has. Quit the app at the top, restart if it keeps happening, and free up disk space. To see apps instead of processes, and what slowed the Mac an hour ago, use a monitor like Vitals.
An Apple silicon Mac should feel fast almost all the time. When it doesn't, when the cursor spins, apps take seconds to switch or the fans spin up for no reason, something specific is wrong. It's rarely the Mac getting old.
Usually it's one of five things: an app using too much CPU, memory running out, heat, a nearly full disk, or macOS doing housekeeping after an update. Activity Monitor, which comes with every Mac, can tell you which, if you know where to look.
This guide takes you through it tab by tab, in about five minutes, then covers what's safe to quit, the processes that look scary but aren't, and where Activity Monitor stops.
Open Activity Monitor
Press Command-Space, type Activity Monitor and press Return. It's also in Applications › Utilities.
It has five tabs along the top: CPU, Memory, Energy, Disk and Network. For a slow Mac, the first two matter most.
Two settings help before you start:
- View › All Processes, so nothing is hidden.
- Click a column's name to sort by it. Click again to flip the order, so the biggest number is at the top.
Step 1: Check the CPU tab
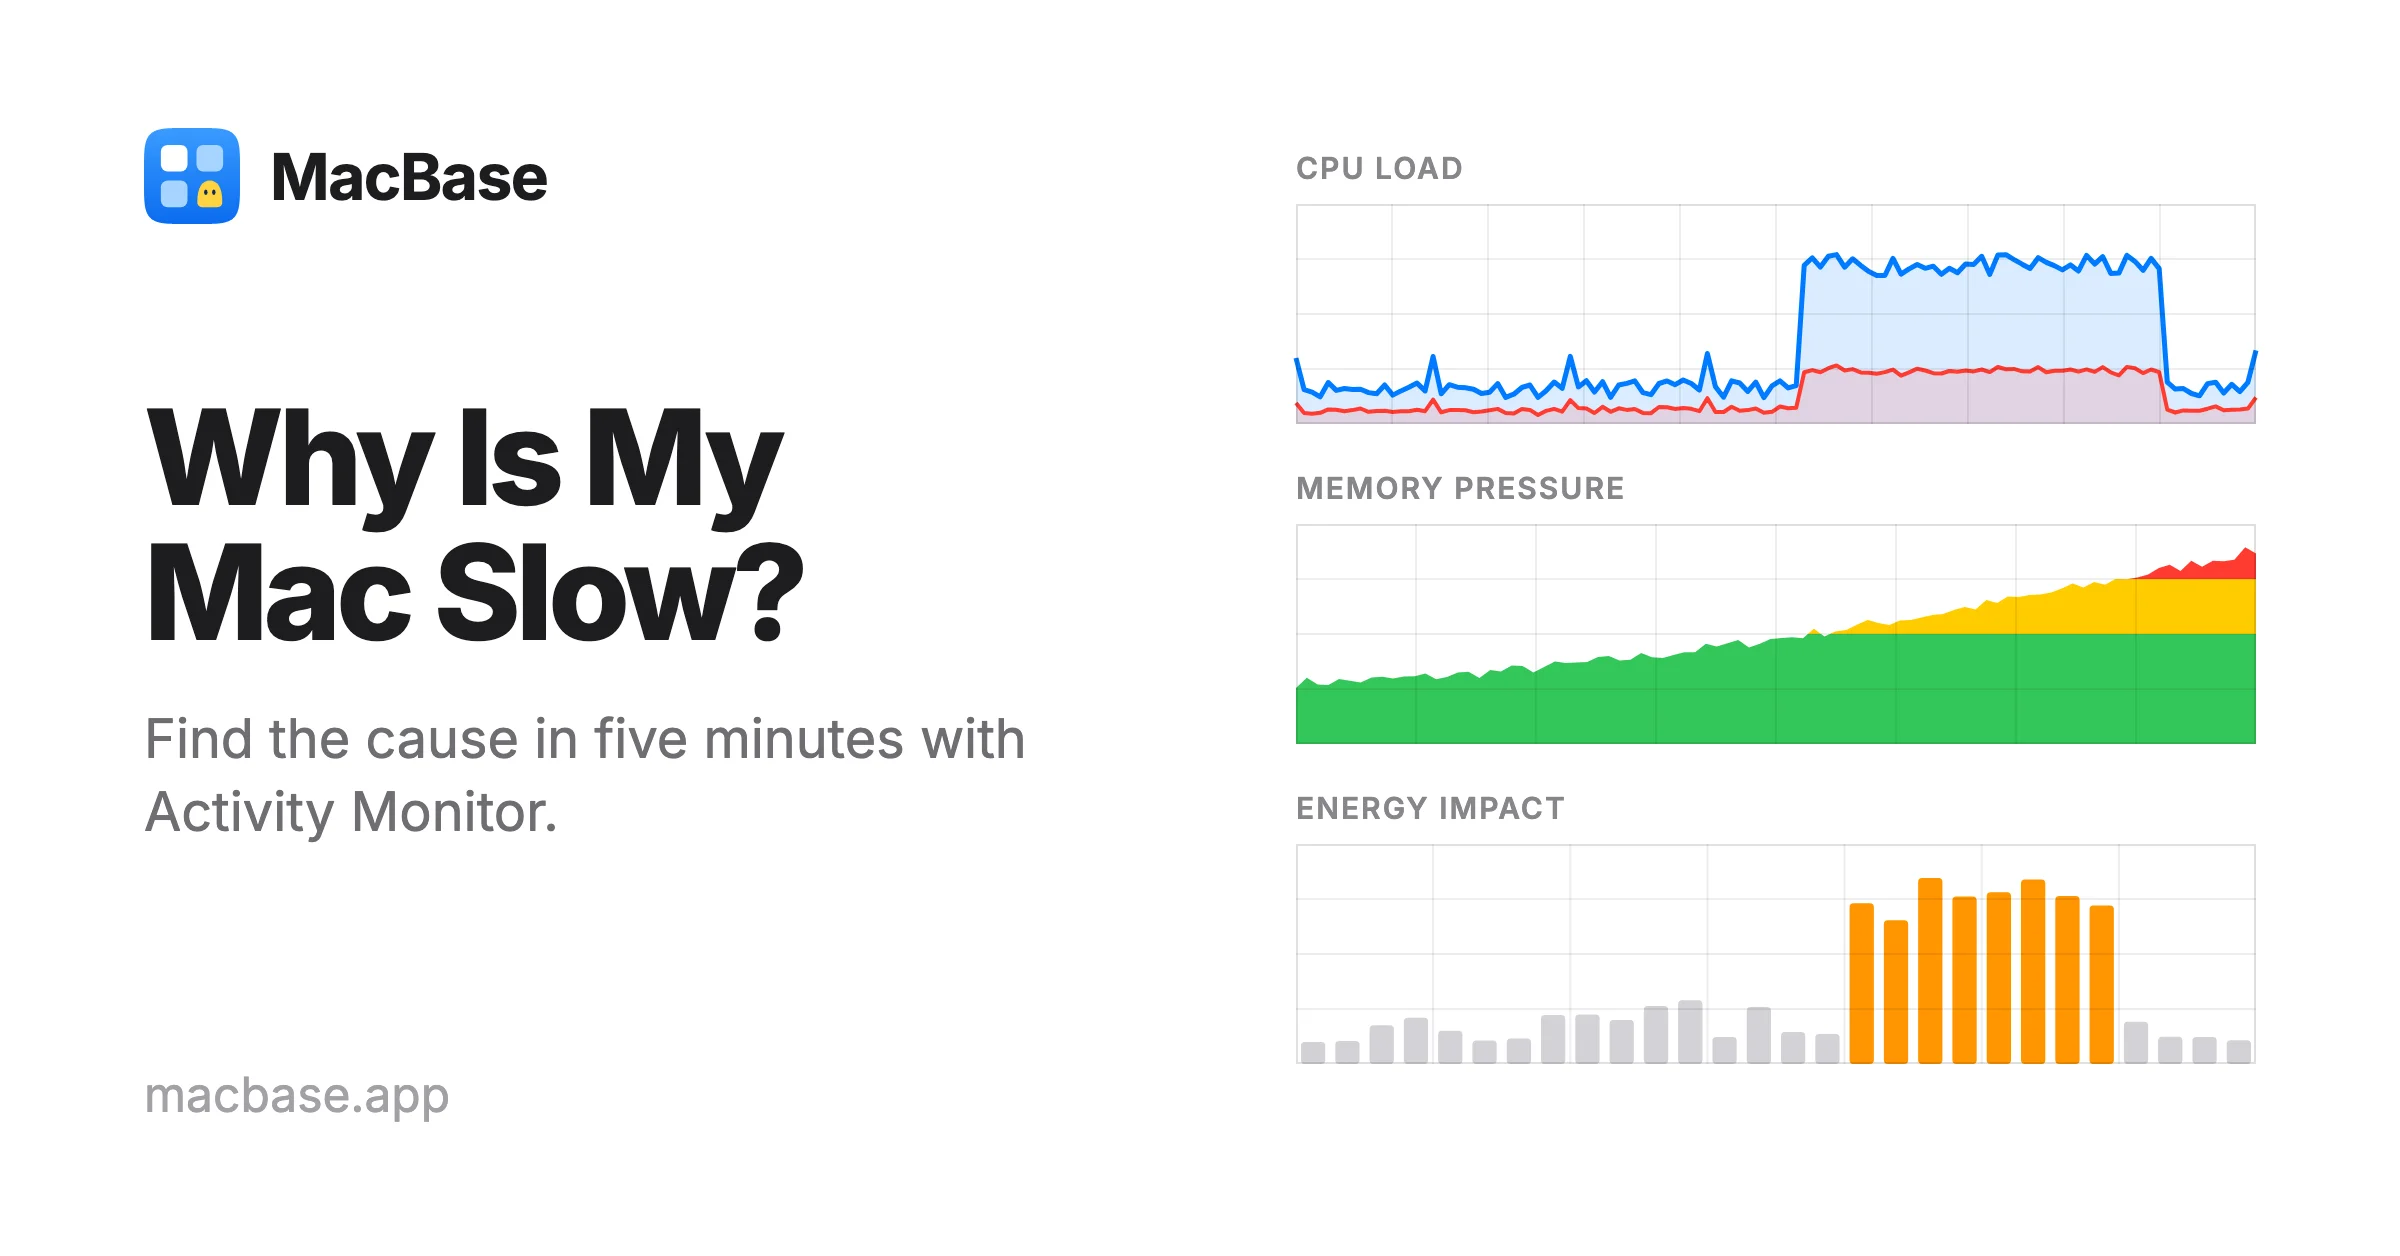
Click CPU, then sort by % CPU, highest first. The top few rows are what's working hardest right now.
What to look for:
- One app far above the rest, at 100% or more, for minutes at a time. 100% means one full CPU core, so a busy app can go well past it.
- Idle at the bottom of the window. On a Mac that isn't doing much, it should be high, often above 90%. If it stays low while you're only reading or writing, something is busy in the background.
- An app you aren't using near the top. That's often a stuck tab, a sync that never finishes or an app that's misbehaving.
Short bursts are normal. Opening an app, exporting a video or building code should use a lot of CPU, then settle down. What slows a Mac is something that stays high.
Step 2: Check memory pressure
Click Memory. Ignore the big Memory Used number for a moment: macOS uses free memory to cache files, so a Mac with little "free" memory isn't necessarily short of it.
The number that matters is the Memory Pressure graph at the bottom:
| Color | What it means | What to do |
|---|---|---|
| Green | Memory is being used well | Nothing; memory isn't your problem |
| Yellow | macOS is compressing memory to make room | Quit apps you aren't using, especially browsers with many tabs |
| Red | Your apps need more memory than the Mac has | Quit apps now; if it's red often, the Mac needs more memory for how you use it |
Next to the graph, Swap Used shows how much memory macOS has moved to the disk. A little is fine. Several gigabytes, growing while you work, means the Mac is short of memory, and that's when everything slows down.
Sort by Memory to see which apps are using the most. Browsers, design apps, Xcode, virtual machines and local AI models are the usual ones.
Step 3: Check the Energy tab
If the problem is battery life more than speed, click Energy.
- Energy Impact shows how much power each app is using now. Sort by it.
- 12 hr Power shows the same over the last 12 hours, so you can catch an app that drained the battery while you weren't looking. It appears when View is set to Applications in Last 12 Hours.
- Preventing Sleep shows which apps are keeping the Mac awake.
Step 4: Check your storage
A nearly full disk slows down everything, because macOS needs free space for swap, caches and updates. Open System Settings › General › Storage to see how much is left.
As a rule of thumb, keep at least 10% of the disk free, and more if you edit video or run virtual machines. If you're short, the Storage page's recommendations are a good start, and apps like DiskMate show what's filling the disk. If you build software, SpaceWise finds the caches that developer tools leave behind, which can run to tens of gigabytes.
The Disk tab in Activity Monitor shows which apps are reading and writing the most right now, which helps when the Mac stutters during a backup or a sync.
How to quit an app safely
Select it in Activity Monitor, click the Stop button (the X in a circle) at the top of the window, then choose:
- Quit, which asks the app to close and lets it save your work. Try this first.
- Force Quit, which closes it at once. Unsaved work in that app is lost.
For an app that has stopped responding, Option-Command-Escape opens the Force Quit window without Activity Monitor.
Don't quit processes you don't recognize just because they're near the top. Some of them are macOS itself, and quitting them logs you out or restarts the Mac. The table below covers the ones people ask about most.
The processes that look scary
| Process | What it is | What to do |
|---|---|---|
| kernel_task | macOS itself. When the Mac is hot, it takes CPU time to keep other apps from using it, so the Mac cools down | Don't quit it. Find what's making the Mac hot, and keep its vents clear |
| WindowServer | Draws everything on your screens | Normal under load. It climbs with several displays, many windows and lots of animation |
| mds, mds_stores, mdworker | Spotlight indexing your files | Temporary after an update, a migration or copying a lot of files. Give it time |
| photoanalysisd, mediaanalysisd | Photos recognizing faces, objects and text | Temporary after importing photos. It works most when the Mac is idle and plugged in |
| backupd | Time Machine backing up | Wait for the backup to finish |
| bird, cloudd, fileproviderd | iCloud Drive syncing | Temporary while files sync. If it never settles, check iCloud Drive in Finder |
| Google Chrome Helper (Renderer) | One Chrome tab or extension each | Close tabs you don't need, or find the heavy one in Chrome's Task Manager |
| launchd, loginwindow | macOS starting and running everything else | Never quit these |
Other fixes worth trying
- Restart. It clears memory, ends stuck processes and finishes installing updates. If your Mac hasn't restarted in weeks, start here.
- Check login items. In System Settings › General › Login Items & Extensions, turn off apps you don't need running all the time.
- Update macOS and your apps. Many slowdowns are bugs that have already been fixed.
- Give it a day after a big update. Spotlight and Photos re-index in the background, and the Mac often feels slow until they finish.
- Watch the heat. A MacBook Air has no fan, so under a long load it slows down to stay cool. Using it on a bed or a lap traps the heat.
Where Activity Monitor falls short
Activity Monitor is good at the basics. But when you're trying to find out why your Mac is slow, it gets in the way in four places:
- It lists processes, not apps. Chrome, Slack, VS Code and most modern apps run as dozens of helper processes, each its own row. The app using your CPU is spread across the list, and you add it up yourself.
- It barely remembers. Apart from 12 hours of energy, it only shows what's happening now. If the Mac was slow an hour ago and fine now, there's nothing to look at.
- No temperatures or fans. macOS doesn't show how hot your Mac is anywhere.
- Nothing in the menu bar. You only see a problem once you open it and go looking.
Vitals: Activity Monitor, with the answers
Vitals is a system monitor built for exactly this question: which app is slowing my Mac, and since when.
Apps instead of processes
Vitals counts every helper process under the app it belongs to, so you see about 40 to 60 apps instead of about 1,000 processes. Below, Google Chrome is one row, 23.88 GB across 123 processes, opened to show its tabs, the browser, the GPU process and its extensions.
What slowed it earlier
Vitals keeps up to a year of history, hour by hour, for the Mac and for each app. So "what was slowing my Mac at 3 pm?" and "has this app been growing in memory all week?" both have an answer.
A warning before it gets slow
CPU, memory, temperatures, fans and more can each sit in the menu bar, and turn red when the Mac is under strain. Vitals also sends a notification when an app uses too much CPU, keeps growing in memory or hammers the disk.
Heat and fans
Vitals reads every temperature sensor, and on Macs with fans it can set them to a fixed speed, follow a curve or run at full speed for a while, so a hot Mac cools down before it slows down.
Price
$19 for a lifetime license at the launch price, or $12 with a year of updates (it keeps working after that), with a 3-day free trial of everything. Vitals is sold on its own site and needs macOS 15 Sequoia or later. For how it compares with iStat Menus, Stats, TG Pro and others, read Best System Monitor for Mac.
Frequently asked questions
Why is my Mac so slow all of a sudden?
Usually one app is using too much CPU or memory, the disk is nearly full, or macOS is indexing after an update. Open Activity Monitor, sort the CPU tab by % CPU and check the Memory Pressure graph in the Memory tab. If nothing stands out, restart the Mac.
Is it safe to quit kernel_task?
No, and you can't. kernel_task is macOS itself. When it uses a lot of CPU, it's keeping other apps from using the CPU so the Mac can cool down. Find what's making the Mac hot instead.
Why is WindowServer using so much CPU?
WindowServer draws everything on your screens. It uses more with several or high-resolution displays, many open windows and animations. Closing windows you don't need and unplugging a display you aren't using bring it down.
What is memory pressure on a Mac?
It's how hard macOS is working to fit your apps into memory, shown as a graph in Activity Monitor's Memory tab. Green is fine. Yellow means macOS is compressing memory. Red means your apps need more memory than the Mac has, and it will slow down.
How much free storage does a Mac need?
As a rule of thumb, keep at least 10% of the disk free, so macOS has room for swap, caches and updates. Check it in System Settings › General › Storage.
Does Activity Monitor slow down my Mac?
Barely. It uses a little CPU while its window is open, and nothing once you quit it.
Written by
I build cool Mac apps. Founder, MacBase.