 Atta 🐬
In this post
- Why an Apple silicon Mac needs a better monitor
- Is Activity Monitor enough?
- 1. Vitals: the all-in-one
- 2. iStat Menus: the most readings in the menu bar
- 3. Stats: the best free one
- 4. ProcessSpy: a deep process inspector
- 5. TG Pro: temperatures
- 6. Macs Fan Control: free fan control
- 7. btop: a monitor in Terminal
- 8. iStatistica Pro: widgets and a web dashboard
- 9. Sensei: monitoring plus cleanup
- 10. coconutBattery: battery health
- The jobs, side by side
- How to choose
- Worth checking
- Frequently asked questions
Quick answer
Vitals is the best system monitor for Mac in 2026. It replaces Activity Monitor with a list of apps instead of processes, and adds a process inspector, up to a year of history, menu bar readings, temperatures, fan control and a command line, in one app from $9. For one job only: iStat Menus is the most complete menu bar monitor, Stats the best free one, ProcessSpy a deep process inspector, TG Pro and Macs Fan Control the heat and fan specialists, and btop the best terminal monitor.
Apple silicon Macs are fast, cool and quiet, and that makes it harder to tell when something's wrong. A MacBook Air has no fan to warn you, memory is shared with the GPU, and a single browser runs as dozens of processes. When the Mac does slow down, run hot or lose battery overnight, macOS gives you Activity Monitor and not much else.
A system monitor shows you what's really going on: which app is using the CPU, memory, GPU and battery, how hot the Mac is, what the fans are doing and what happened while you weren't looking. I compared the 10 best-known system monitors for Mac on what they show, what they cost and which jobs they cover. Prices and requirements are from each maker's site in November 2026.
| # | App | Best for | Price | Runs in |
|---|---|---|---|---|
| 1 | Vitals | All of it, in one app | $9, or $15 lifetime | Window, menu bar, Terminal |
| 2 | iStat Menus | The most readings in the menu bar | $11.99 | Menu bar |
| 3 | Stats | A free menu bar monitor | Free | Menu bar |
| 4 | ProcessSpy | Inspecting processes | Free, Pro $34.99 | Window, menu bar |
| 5 | TG Pro | Temperatures | $10 | Window, menu bar |
| 6 | Macs Fan Control | Free fan control | Free, Pro extra | Window, menu bar |
| 7 | btop | A monitor in Terminal | Free | Terminal |
| 8 | iStatistica Pro | Widgets and a web dashboard | $9.99 | Window, menu bar, widgets |
| 9 | Sensei | Monitoring plus cleanup | $29 a year, or $59 | Window, menu bar |
| 10 | coconutBattery | Battery health | Free, Plus extra | Window, menu bar |
Why an Apple silicon Mac needs a better monitor
M1 through M5 Macs changed what's worth watching. Most of the old reasons to run a monitor still apply, and a few new ones came with the chips.
- Memory is shared. The CPU, GPU and Neural Engine all draw from the same unified memory. A browser, Xcode, a design app and a local AI model can fill 16 GB quickly, and then macOS compresses memory and swaps to the SSD. Activity Monitor's memory pressure graph shows that it's happening, not which app caused it.
- Heat costs you speed, not noise. A MacBook Air has no fan, so under a long load it slows itself down to stay cool. A MacBook Pro or Mac mini only spins its fans up when it's already hot. macOS doesn't show a single temperature anywhere.
- Apps are made of helpers. Chrome, Slack, VS Code, Figma and other apps run each tab, window or extension as its own process. Activity Monitor lists them one by one, so the app actually using your CPU is spread across dozens of rows.
- The GPU does more. Games, video, design tools and local AI models all lean on the GPU, which Activity Monitor only shows in a separate history window.
- Battery drain happens when you're not looking. A Mac can wake overnight, an app can keep it from sleeping, and Activity Monitor's energy history goes back only 12 hours.
A good monitor answers the questions you actually have: which app, since when, how hot, and what can I do about it.
Is Activity Monitor enough?
Activity Monitor is free, already on your Mac (open it with Spotlight, or from Applications > Utilities) and good at the basics: CPU, Memory, Energy, Disk and Network tabs, a GPU history window and a Force Quit button. It can also sample a process or take a spindump, which few other apps do.
Where it stops:
- It lists processes, not apps. Above, Zoho Mail, Termius, Claude, Brave and Chrome each appear several times, as helpers mixed in with system processes. You have to add them up yourself.
- It barely remembers. Energy goes back 12 hours. Nothing else has a history.
- No temperatures, no fans, no alerts, and nothing in the menu bar beyond a CPU graph on its Dock icon.
If you only open it once a month to quit a frozen app, it's enough. If you want to know why your Mac is slow, hot or draining its battery, you need one of these.
1. Vitals: the all-in-one
Vitals started as an Activity Monitor alternative and grew into the one app that does every job on this list: a list of apps instead of processes, a process inspector, a year of history, menu bar readings, temperatures, fan control and a command line. Where the other nine each do one or two of these, Vitals does them all, in one window.
Apps, not processes
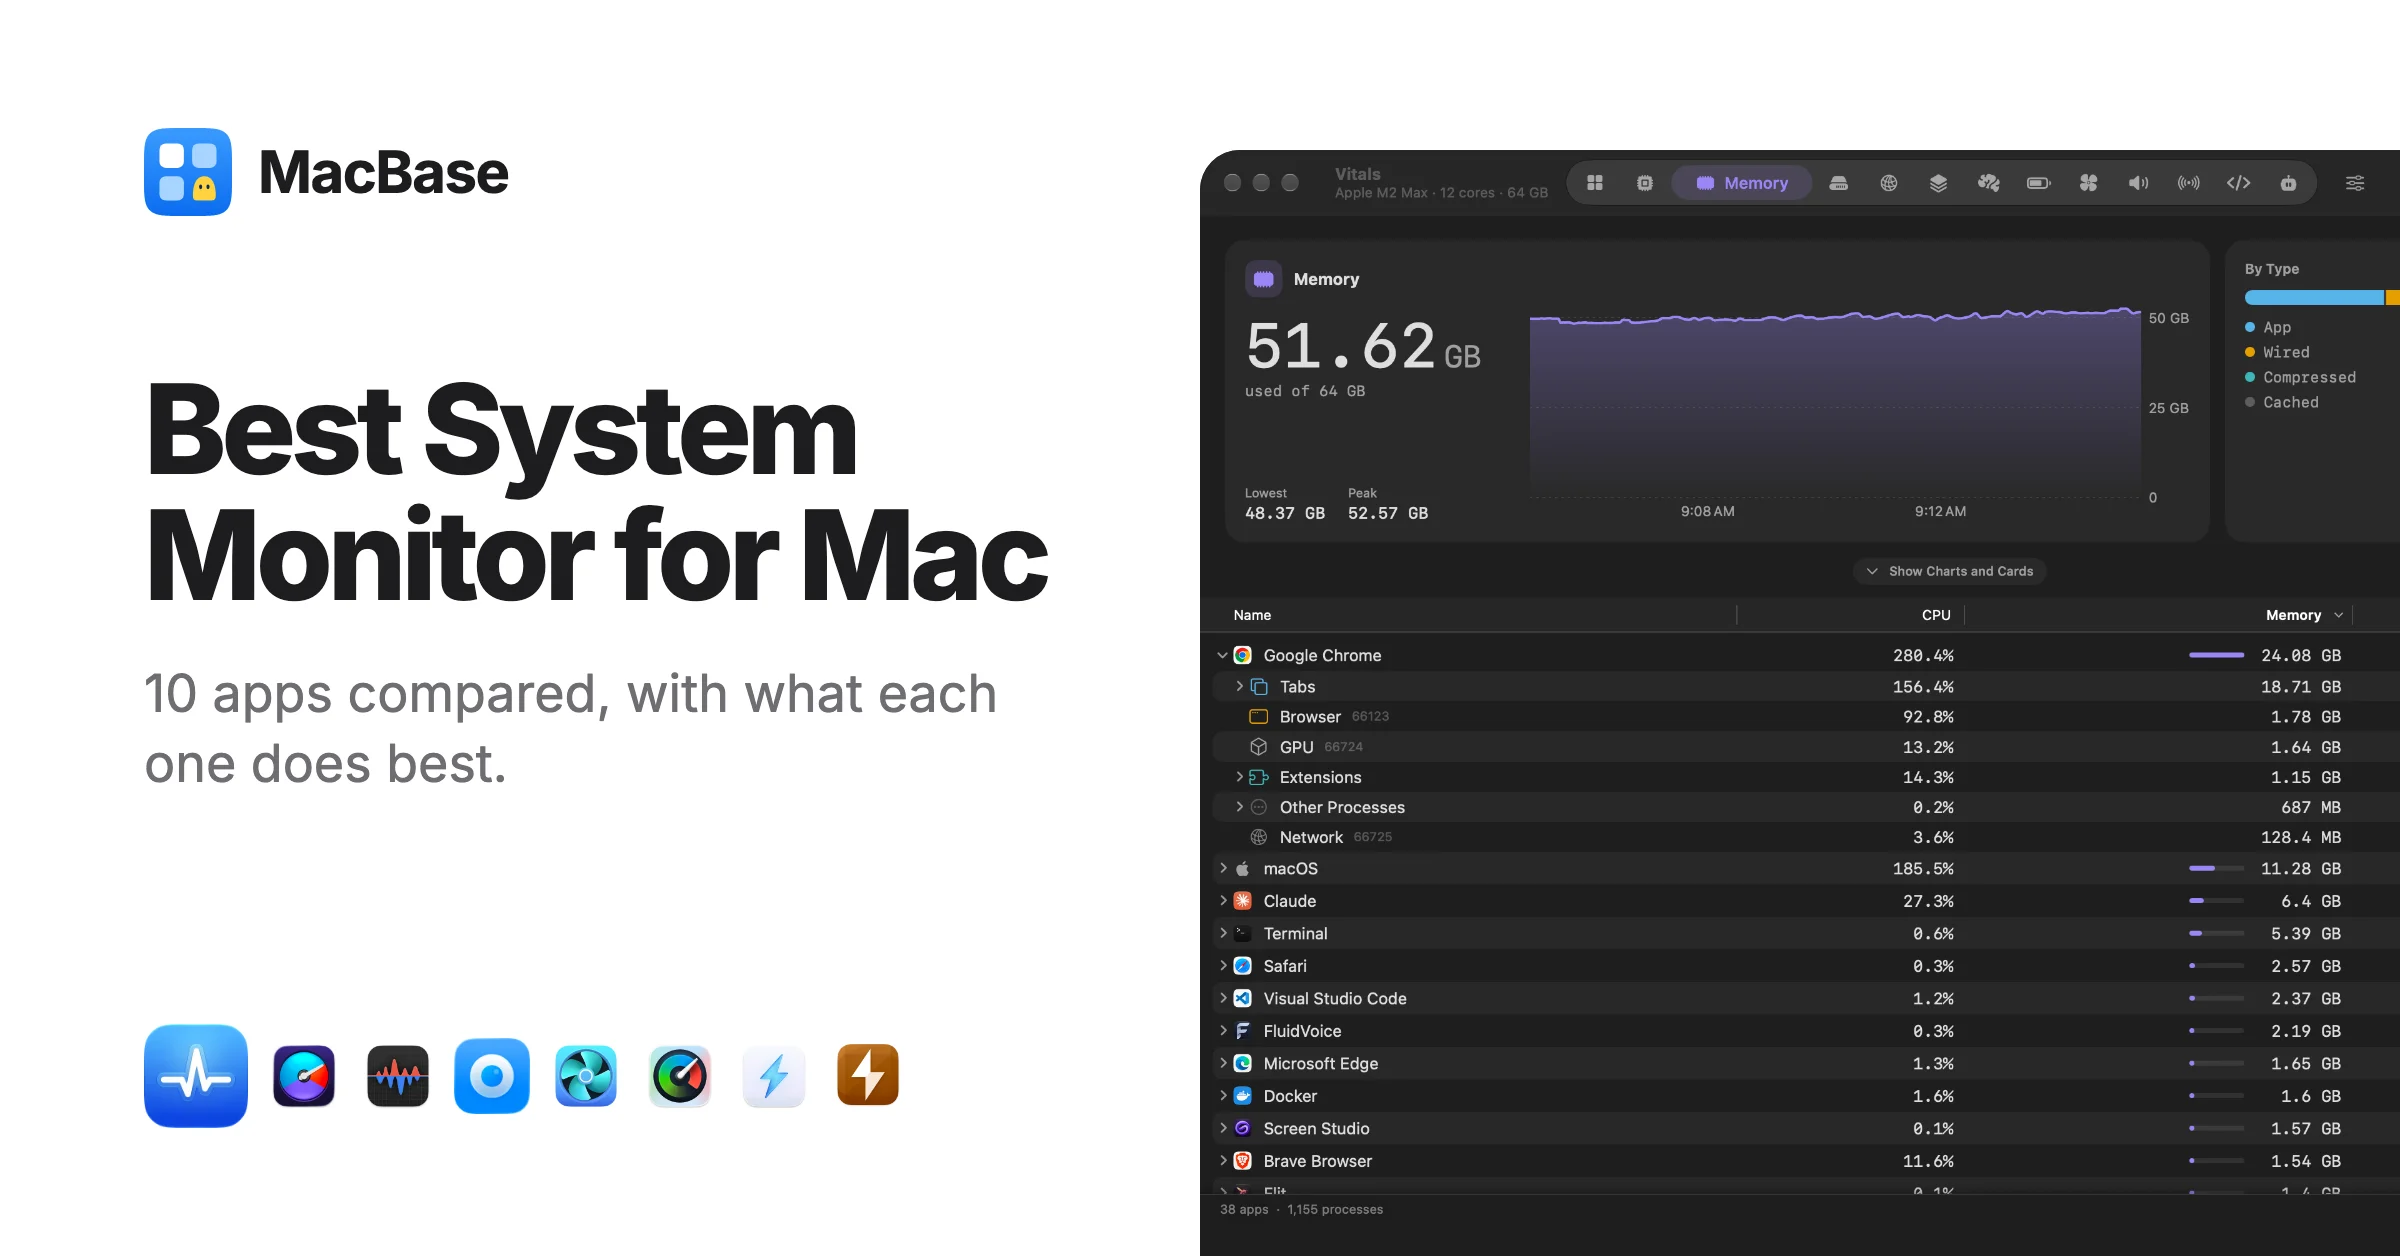
Vitals groups every helper process under the app it belongs to. Instead of about 1,000 processes, you see about 40 to 60 apps, each with its CPU, memory, energy, GPU, disk and network. Below, Google Chrome is one row, 23.88 GB across 123 processes, opened to show where it goes: its tabs, the browser, the GPU process, extensions and the network process.
Process Inspector
Click any process to see everything about it: the app it belongs to, its code signature and Team ID, hardened runtime and sandbox, its entitlements, and whether it runs natively or under Rosetta. It shows its parent, the launch agent that starts it at login, its full command line and environment, open files, listening ports and child processes, with CPU time and memory against its peak. You can suspend, resume or send it a signal, and save the details as CSV.
History
Vitals keeps up to a year of history, hour by hour, for the Mac and for each app. "What was slowing my Mac yesterday at 3 pm?" finally has an answer, and so does "has this app been growing in memory all week?"
Menu bar
CPU, memory, GPU, disk, network, battery, temperatures and fans each get their own menu bar item, as a value, a graph or both. Drag them into the order you like, and they turn red when the Mac is under strain. A click opens an overview of the whole Mac and the apps busiest right now.
Temperatures and fan control
Vitals reads every sensor, with the most detail on Apple silicon, and controls the fans on Macs that have them:
- Automatic, leaving it to macOS.
- Fixed, with a slider for each fan.
- A curve you draw, following the CPU, GPU, hottest sensor or battery, starting from the Quiet or Cool presets.
- Max, for 5, 15 or 30 minutes, or while an app is working.
Rules like Quiet on Battery and Cool While Apps Work Hard switch the fans for you, and they go back to automatic when Vitals quits.
Alerts and battery
Vitals sends a notification when an app uses too much CPU, keeps growing in memory or hammers the disk or network. The Battery tab shows what's keeping the Mac awake, the battery's maximum capacity and cycle count, how long a charge really lasts, and how much power each app draws.
Command line
The vitals command answers in Terminal: vitals status for the whole Mac, vitals top for the busiest apps now or over a past period, vitals process for any process, vitals ports, vitals history and vitals whats-wrong. Every command prints a table, or JSON with --json, and --watch keeps it updating.
For developers
Vitals lists the projects running on your Mac with their ports, flags dev servers left idle, shows Docker containers, and tracks coding agents like Claude Code, Codex and Cursor, with how much of each AI plan is left. Its MCP server lets an assistant ask Vitals what's going on before it touches anything.
Price and requirements
$9 with a year of updates (it keeps working after that), or $15 for a lifetime license at the launch price, with a 3-day free trial of everything. It needs macOS 15 Sequoia or later, on Apple silicon or Intel, runs in 13 languages, needs no account and keeps everything on your Mac. With no window open, it uses about 0.1% of one CPU core.
It's sold on its own site, not the Mac App Store, because the App Store's sandbox doesn't allow reading other apps' processes. Fan control and the details of system processes use an optional helper you turn on in Settings.
2. iStat Menus: the most readings in the menu bar
iStat Menus, by Bjango, has been the menu bar monitor most people know for over a decade. Version 7 covers CPU, GPU, memory, disks, network, sensors, battery, power and even the weather, each in its own menu bar item with a detailed dropdown.
It can control fan speed and ramp it with temperature or battery state, and its Rules send a notification for things like high CPU or a changed public IP. The CPU and memory dropdowns list the apps using the most.
Price: $11.99 on the Mac App Store, or in Setapp, with a 14-day free trial from Bjango. Needs: macOS 13.5 or later.
Where it stops: it lives in the menu bar. There's no full list of apps or processes and no inspector, so it tells you the Mac is busy more than why.
In Vitals: every reading is its own menu bar item too, and a click takes you to the app behind it, with its history.
3. Stats: the best free one
Stats is a free, open-source menu bar monitor with more than 43,000 stars on GitHub. It covers CPU, GPU, memory, disk, network, battery, sensors and Bluetooth devices, plus a clock for other time zones, and installs with brew install stats.
Price: free, under the MIT license. Needs: macOS 12 or later.
Where it stops: its fan control is marked as no longer maintained, and its sensor names on Apple silicon don't match individual cores. The Sensors and Bluetooth modules are its heaviest, and its maker says turning them off can cut its CPU use by up to half.
In Vitals: the same readings, plus apps instead of processes, a year of history, alerts and fan control that's actively developed.
4. ProcessSpy: a deep process inspector
ProcessSpy is a process monitor for people who find Activity Monitor too shallow. It keeps CPU and memory history for each process, a list of processes that have already finished, the QoS breakdown of CPU time and real-time disk activity. Its inspector shows a process's environment variables, signature and what launched it, and you can filter with regular expressions or JavaScript.
Price: free for the core features, or $34.99 once for the rest, also in Setapp. Needs: macOS 14 or later.
Where it stops: it's about processes, so there are no temperatures, fans or battery, and helpers aren't added up into apps.
In Vitals: the Process Inspector shows the signature, Team ID, entitlements, parent, launch agent, command line, environment, open files, ports and children of any process, and the app it belongs to.
5. TG Pro: temperatures
TG Pro, by Tunabelly Software, is the best-known app for Mac temperatures. It shows CPU temperatures per core on Apple silicon, the GPU, drives, battery and more, with diagnostics for fans, sensors, battery health and the last shutdown.
Its Auto Boost rules raise fan speed at the temperatures you choose, or you can set it by hand. It can notify or email you at a temperature limit and log everything to CSV.
Price: $10 once, with a 14-day free trial. Needs: macOS 10.14 or later, on Apple silicon or Intel.
Where it stops: it's about heat. It shows how hot the Mac is, not which app is making it hot.
In Vitals: every sensor and fan sits next to the apps using the CPU and GPU, so you can see the cause and cool it with a fan curve.
6. Macs Fan Control: free fan control
Macs Fan Control, by CrystalIDEA, is the free app people install when their Mac runs hot. Each fan can stay on Auto, run at a fixed speed, or follow a temperature sensor you pick. Fan speeds and temperatures can show in the menu bar, and it also works in Windows on Intel Macs through Boot Camp.
Price: free, with a one-time Pro license for custom fan presets. Needs: macOS 12 or later, on Apple silicon or Intel.
Where it stops: fans and temperatures are all it does.
In Vitals: fixed speeds for each fan, curves that follow the CPU, GPU, hottest sensor or battery, a timed Max, and rules like Quiet on Battery, next to the rest of the Mac's readings.
7. btop: a monitor in Terminal
btop is a free, open-source resource monitor for the terminal, with 35,000 stars on GitHub. It shows CPU, memory, disks, network and processes in a graphical layout, works with the mouse, can send any signal to a process and comes with themes. Install it with brew install btop.
Price: free, under the Apache 2.0 license. Needs: macOS, Linux or BSD.
Where it stops: it shows processes, not apps, and only for as long as it's open, with no history or alerts.
In Vitals: vitals top, vitals status and vitals process give the same answers in Terminal, grouped by app, with history behind them and JSON for scripts.
8. iStatistica Pro: widgets and a web dashboard
iStatistica Pro, by Imagetasks, shows CPU, memory, disk, network, battery, GPU and sensors in the menu bar and in widgets. It also has a web dashboard and a REST API, so you can check a Mac from your phone or another machine, and alerts that can run a command or workflow.
Price: $9.99 on the Mac App Store, or $5.99 for iStatistica without the Pro features. Needs: macOS 10.11 or later.
Where it stops: temperatures, fan speeds and disk activity need a separate Sensors plug-in.
9. Sensei: monitoring plus cleanup
Sensei, by Cindori, mixes a monitor with Mac maintenance. It has a menu bar monitor, a thermal dashboard with temperatures and fan speeds, battery and drive health reports and a disk benchmark, plus a cleaner and an uninstaller.
Price: $29 a year, or $59 once, for up to 3 Macs. Needs: a recent macOS on Apple silicon or Intel.
Where it stops: monitoring is one part of a toolbox, and it doesn't go as deep on apps and processes as the others here.
10. coconutBattery: battery health
coconutBattery has been the standard battery checker since 2005. It shows your MacBook's battery health, charge and history, and does the same for an iPhone or iPad you connect. The Plus upgrade adds a lifetime analyzer, SSD statistics and notifications.
Price: free, with a one-time Plus license. Needs: macOS 12 or later.
Where it stops: it's only about batteries.
In Vitals: the Battery tab shows maximum capacity and cycle count too, plus what's draining the battery and what's keeping the Mac awake.
The jobs, side by side
✓ means the app does it. – means its maker doesn't list it.
| App | Apps, not processes | Process inspector | History | Menu bar | Temperatures | Fan control | Terminal |
|---|---|---|---|---|---|---|---|
| Vitals | ✓ | ✓ | Up to a year | ✓ | ✓ | ✓ | ✓ |
| Activity Monitor | – | Basic | Energy, 12 hours | – | – | – | – |
| iStat Menus | – | – | ✓ | ✓ | ✓ | ✓ | – |
| Stats | – | – | – | ✓ | ✓ | Not maintained | – |
| ProcessSpy | – | ✓ | ✓ | ✓ | – | – | – |
| TG Pro | – | – | CSV logs | ✓ | ✓ | ✓ | – |
| Macs Fan Control | – | – | – | ✓ | ✓ | ✓ | – |
| btop | – | – | – | – | – | – | ✓ |
| iStatistica Pro | – | – | – | ✓ | With plug-in | – | – |
| Sensei | – | – | – | ✓ | ✓ | – | – |
| coconutBattery | – | – | Battery | ✓ | – | – | – |
How to choose
- "My Mac is slow and I don't know why." Vitals, for the app behind the numbers and when it started.
- "I just want numbers in the menu bar." iStat Menus, or Stats if it has to be free.
- "My Mac runs hot or loud." Vitals or TG Pro for temperatures with fan rules, or Macs Fan Control for free.
- "I need to know exactly what a process is." Vitals or ProcessSpy.
- "I live in Terminal." Vitals' command line, or btop.
- "I'm worried about my battery." coconutBattery for its health, Vitals for what's draining it.
Worth checking
These didn't make the top 10, but each is good at something:
- CleanMyMac's menu, if you already use CleanMyMac.
- htop, the classic terminal monitor that runs on almost any machine.
- App Tamer, which slows down apps that use too much CPU in the background.
- Taskglass, which explains what's slowing your Mac, for $5.
- HeartbeatMac, another Activity Monitor alternative that groups processes by app, for $5.
- Telltale, which shows what slows down, heats up or drains your Mac, for $5.
- Blame, which finds what's slowing your Mac and offers fixes, for $29.
- iSurge, a set of system tools for the menu bar and notch, for $14.99.
- Cortex, for watching local AI workloads, for $5.
- MacMetra, CPU, memory and thermal state in one menu bar item, for $2.99.
- StatJack, a free, open-source menu bar monitor.
- Dormouse, which tells you why your MacBook woke up and lost battery overnight, for $4.99.
Frequently asked questions
Is Activity Monitor enough?
For quitting a frozen app or a quick look at CPU, yes. It lists processes rather than apps, keeps only 12 hours of energy history and has no temperatures, fans, alerts or menu bar readings, so for finding out why a Mac is slow or hot, a system monitor like Vitals tells you more.
How do I check my Mac's temperature?
macOS doesn't show temperatures. Use a system monitor with sensors: Vitals, iStat Menus, TG Pro, Stats or Macs Fan Control all show CPU, GPU and other temperatures, and can put them in the menu bar.
Can I control fan speed on an Apple silicon Mac?
Yes, on Macs that have fans. Vitals, iStat Menus, TG Pro and Macs Fan Control can set a fixed speed or raise it with temperature, within the range each fan supports. A MacBook Air has no fan, so these apps can only show its temperatures.
What's the best free system monitor for Mac?
Stats, for the menu bar, and btop, for Terminal. Macs Fan Control is the best free app for fans, and coconutBattery for battery health.
Do system monitors slow down a Mac?
A good one barely registers. Vitals uses about 0.1% of one CPU core with no window open. Apps that read every sensor often do more work; Stats' maker says turning off its Sensors and Bluetooth modules can halve its CPU use.
See every app in System Monitoring on MacBase, with its price and the macOS it needs.
Written by
I build cool Mac apps. Founder, MacBase.